WeDefense - How to debug?
1. commond line
(1) Create a new config/config_debug.yaml for debug with specific config for data loader, especially num_workers: 0 and prefetch_factor: :
dataloader_args:
  batch_size: 10
  num_workers: 0
  pin_memory: False
  prefetch_factor:
  drop_last: True
(2) Create a run_debug.sh for debugging, you can find a sample in
In
run_debug.sh, you can use:-m pdbsame as we did forpython -m pdb.py [args], here we are using torchrun
    torchrun --rdzv_backend=c10d --rdzv_endpoint=$(hostname):$((RANDOM)) --nnodes=1 --nproc_per_node=1 \
	    -m pdb \ #<- this line is added for pdb debugging.
      wedefense/bin/train.py  \
  # other parameters.
If you do not want to run from
run_debug.sh, you can launch from torchrun directly with proper paramters and variables.
source ./path.sh
config="conf/config_debug.yaml"
exp_dir="exp/debug"
gpus="[0]"
num_avg=2
data="data/partialspoof"
data_type="raw" #shard

torchrun --rdzv_backend=c10d --rdzv_endpoint=$(hostname):$((RANDOM)) --nnodes=1 --nproc_per_node=1 \
      wedefense/bin/train.py --config $config \
        --exp_dir ${exp_dir} \
        --gpus $gpus \
        --num_avg ${num_avg} \
        --data_type "${data_type}" \
        --train_data ${data}/train/${data_type}.list \
        --train_label ${data}/train/utt2lab \
        --val_data ${data}/dev/${data_type}.list \
        --val_label ${data}/dev/utt2lab \
        ${checkpoint:+--checkpoint $checkpoint}
  # other parameters.
In the -m pdb mode, you can use command below
Within Pdb interpreter:
Command |
Description |
|---|---|
|
List 11 lines surrounding the current line |
|
Display the file and line number of the current line |
|
Execute the current line |
|
Step into functions called at the current line |
|
Execute until the current function’s return is encountered |
Controlling Execution and Debugging
Command |
Description |
|---|---|
|
Create a breakpoint at line |
|
List breakpoints and their indices |
|
Execute until a breakpoint is encountered |
|
Clear breakpoint with index |
Changing Variables / Interacting with Code
Command |
Description |
|---|---|
|
Print value of the variable |
|
Execute the expression |
|
Restart the debugger with |
|
Exit the debugger |
Please refer to references if you want to get more information:
2. vscode/cursor
If you prefer IDE, you can run Run → Start Debugging tools for debugging.
2.1 Option 1: Launch debug from a debug icon
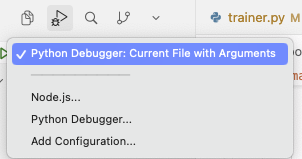
you may choose python debugger with arguments
then input them
or write into a config file
{
  "version": "0.2.0",
  "configurations": [
    {
      "name": "Debug WeDefense train (args)",
      "type": "python",
      "request": "launch",
      "program": "${workspaceFolder}/debug_train.py",
      "console": "integratedTerminal",
      "justMyCode": false,
      "args": [
        "--config", "conf/config_debug.yaml",
        "--exp_dir", "exp/debug",
        "--gpus", "[0]",
        "--num_avg", "2",
        "--data", "data/partialspoof",
        "--data_type", "raw"
      ]
    }
  ]
}
or create a debug() function inside of the script to launch, and modify the starting function
def debug():
  # input your testing code here

if __name__ == "__main__":
  debug()
2.2 Option 2: Prepare a debugging startup script.
(provided with chatgpt, but some issues exist for multiple gpus)
# debug_train.py
# Run with VSCode/Cursor debugger (single node, single process) like torchrun.
import os
import sys
import socket
from pathlib import Path


def find_free_port() -> int:
    """Pick an available local TCP port."""
    with socket.socket(socket.AF_INET, socket.SOCK_STREAM) as s:
        s.bind(("127.0.0.1", 0))
        return s.getsockname()[1]


def main():
    # ---- align with your bash variables ----
    config = "conf/config_debug.yaml"
    exp_dir = "exp/debug"
    gpus = "[0]"
    num_avg = "2"
    data = "data/partialspoof"
    data_type = "raw"  # "shard"

    # ---- resolve paths (optional but safer) ----
    repo_root = Path(__file__).resolve().parent
    train_py = repo_root / "wedefense" / "bin" / "train.py"
    if not train_py.exists():
        raise FileNotFoundError(f"Cannot find: {train_py}")

    train_data = repo_root / data / "train" / f"{data_type}.list"
    train_label = repo_root / data / "train" / "utt2lab"
    val_data = repo_root / data / "dev" / f"{data_type}.list"
    val_label = repo_root / data / "dev" / "utt2lab"

    # ---- torchrun-equivalent args ----
    master_addr = socket.gethostname()
    master_port = find_free_port()
    rdzv_endpoint = f"{master_addr}:{master_port}"

    # If you need checkpoint, set it here; else keep None
    checkpoint = None  # e.g. "exp/debug/ckpt.pt"

    # Build argv exactly like your command
    argv = [
        "torchrun",
        "--rdzv_backend=c10d",
        f"--rdzv_endpoint={rdzv_endpoint}",
        "--nnodes=1",
        "--nproc_per_node=1",
        str(train_py),
        "--config", config,
        "--exp_dir", exp_dir,
        "--gpus", gpus,
        "--num_avg", num_avg,
        "--data_type", data_type,
        "--train_data", str(train_data),
        "--train_label", str(train_label),
        "--val_data", str(val_data),
        "--val_label", str(val_label),
    ]
    if checkpoint:
        argv += ["--checkpoint", checkpoint]

    # ---- IMPORTANT: call torch.distributed.run (what torchrun uses) ----
    # This keeps everything in a normal Python process so the debugger can attach.
    from torch.distributed.run import main as torchrun_main

    print("Launching with args:\n", " ".join(argv))
    # torchrun_main reads sys.argv
    sys.argv = argv
    torchrun_main()


if __name__ == "__main__":
    main()
[!NOTE] .ignore file will skip all files start with “debug.” Please remember to comment out this row if you want to keep track such files.